|
 Until recently, in
Air Traffic Management facilities information about several kinds of potential
hazards has been presented to air traffic controllers and air traffic
managers on separate displays. Air traffic, weather, terrain hazards,
and other operational symbology are all displayed in 3-space and time
coordinates, but in most cases the users had to monitor the information
on separate displays and integrate all of the information in their minds.
Combining all of the information in a single display should allow greater
accuracy and reduced cognitive workload. A number of integrated displays
are under development in various laboratories.
Until recently, in
Air Traffic Management facilities information about several kinds of potential
hazards has been presented to air traffic controllers and air traffic
managers on separate displays. Air traffic, weather, terrain hazards,
and other operational symbology are all displayed in 3-space and time
coordinates, but in most cases the users had to monitor the information
on separate displays and integrate all of the information in their minds.
Combining all of the information in a single display should allow greater
accuracy and reduced cognitive workload. A number of integrated displays
are under development in various laboratories.
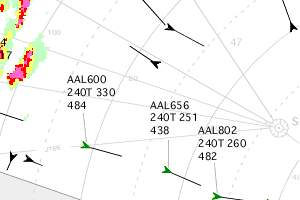
Color usage in these integrated displays is more complicated than in separate
displays. Aircraft symbols and data tags move relative to each other and
the background symbology. Areas of weather move relative to the fixed
background and the aircraft. The displays therefore involve many more
combinations of symbol and background colors than in simpler displays.
Even without the variable background colors, the increased density of
symbology increases the need for the information presentation to provide
good attention management.
Our laboratory is studying various color designs for these integrated
displays.
Design of a Prototype
Integrated ATM Display:
../cockpit_1.html
|
|